10 Top Network Monitoring Tools for Linux Systems
Network monitoring uses Linux tools like Zabbix and Nagios to track and manage network health, ensuring performance and security by detecting and addressing issues promptly.
🤖AI Overview:
Network monitoring continuously tracks network device performance and connection health to detect and resolve problems quickly. Popular Linux tools like Zabbix, Nagios, and Icinga help system administrators maintain optimal network operations by monitoring metrics such as bandwidth, uptime, and resource usage.
What are Linux Network Monitoring Tools and Why Install them?
Performance monitoring is not the same as bandwidth monitoring. You can use network monitoring tools to measure, access, and improve the performance and metrics of your Linux system to be able to troubleshoot any probable issues, fix the cause of them, and increase your system’s operation.
Since Linux systems have higher user involvement and decodable security bugs, it makes sense to test or monitor all network performance measures. IT specialists and Linux system administrators prefer to manage network systems and troubleshoot them before facing huge and irrecoverable damages. It requires collecting all device statistics and traffic data that the device agents generate. Performance analysis can be stored using data that has been collected on device states. This aids in capacity planning for network management. When using a Linux network monitoring tool, when the device agent notices issues, it will send a warning. The network monitoring tool can interpret these alerts, also known as traps, as warnings. With the use of alerts, the IT support team can leave the monitor to monitor the network while continuing to presume everything is in order unless otherwise informed.
Stay with us in this guide to get familiar with the best Linux network monitoring tools.
Linux Top 10 Performance and Network Monitoring Tools in 2023
On the market, there are numerous outstanding network monitoring tools. Do not waste your time studying all of them to find out which one is designed for your Linux environment or meets your needs and priorities. We have compiled the 10 best Linux Monitoring Tools to help you choose to install on your server after buying Linux VPS. Some of the following Linux networking monitoring tools are available for Windows, macOS, and Unix. But all of them can be installed on Linux.
1. Zabbix
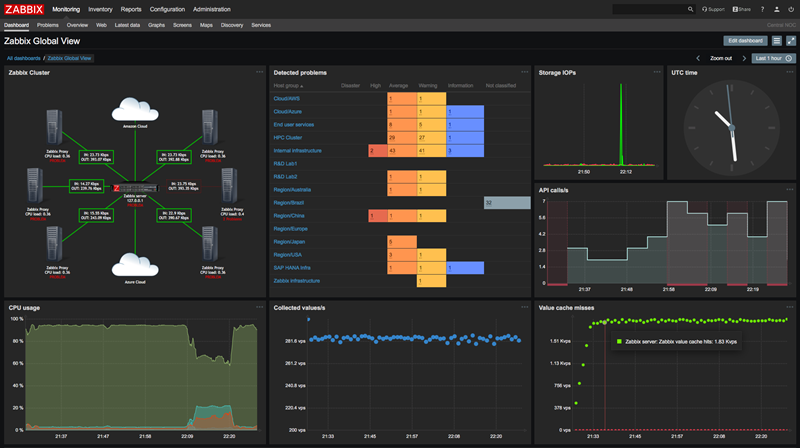
Zabbix is a free and open-source distributed monitoring solution that is created by Alexei Vladishey and written under the GPL General Public License version 2. Zabbix is a program that keeps track of various network metrics as well as the functionality and integrity of servers, virtual machines, applications, services, databases, websites, the cloud, and other things. With Zabbix’s adaptable notification system, users may set up email-based notifications for practically any occurrence. This enables quick response to server issues. Based on the recorded data, Zabbix provides strong reporting and data visualization options. Zabbix is therefore perfect for capacity planning.
Zabbix is one of the most popular and easily available Linux network monitoring tools that work with Linux, Unix, Windows, and Solaris systems, making it a top choice for IT professionals of all stripes. Polling and trapping are both supported by Zabbix. A web-based frontend is used to access all Zabbix statistics, reports, and configuration settings. The state of your network and the condition of your servers may be evaluated from any location thanks to a web-based client. When configured correctly, Zabbix may be quite useful for keeping an eye on IT infrastructure. This is true for both small businesses with a few servers and large businesses with a huge number of servers. As an SNMP-based system, this one has alerts as well. Status notifications can be set to be sent through email, SMS, or chat application in addition to being displayed in the dashboard.
If you are using CentOS and RHEL, refer to our related article to learn How to Install Zabbix on CentOS 8 and RHEL 8.
Why Choose Zabbix?
- Free and Open source.
- Professional Look of User Interface.
- Monitors most network-attached devices & Networking equipment.
- Runs local scripts to fix issues automatically.
- Monitors multiple sites and cloud resources.
- Good choice for small businesses.
- Monitors LANs, Wireless networks, Cloud-base resources, and remote sites.
- Encrypted communication with remote data collectors.
- Monitors bandwidth, device health, performance, CPU, and memory usage.
- Security and authentication
Notes You Should Know Before Choosing Zabbix
- Zabbix is not appropriate for large enterprise environments since it has no paid support option.
- Zabbix comes with Weak templates for rich monitoring.
- Zabbix needs UI/UX to be catchier and more detailed.
- Zabbix does not include Amazon RDS.
2. Nagios
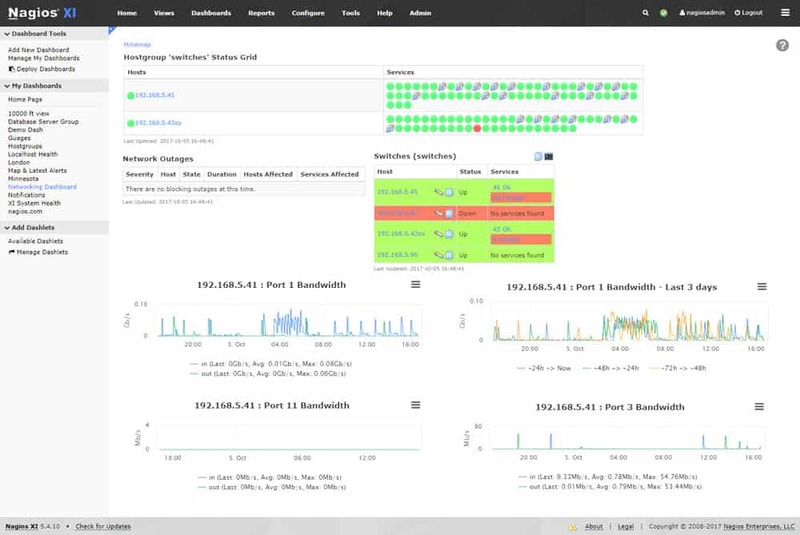
Nagios is one of the best and most flexible server monitoring software on the market. It monitors servers with both agent-based and agentless monitoring. It comes with over 5000 different add-ons to monitor your servers. Using Nagios XI, you can monitor all mission-critical infrastructure components including applications, services, operating systems, network protocols, systems metrics, and network infrastructure.
Your log data search can be made much simpler with Nagios Log Server. Set alerts to inform you of potential hazards, or use log data queries to quickly audit any system. With Nagios Log Server, high availability and fail-over are built-in, and you get all of your log data in one place. As one of the Linux network monitoring tools, Nagios Fusion provides your network with a high level of visibility and scalability, aiding in the resolution of issues brought on by numerous networks and geographic separation. Network Analyzer is an open-source data monitoring program that is available as a free trial version from Nagios as well as in a more condensed form called Nagios Core. Upon request, the Network Analyzer free trial’s parameters are made available. Centralization makes network administration easier by enabling you to view several Nagios XI and Core servers in one place.
There are two editions of Nagios XI: Standard and Enterprise. Capacity planning and auditing are additional capabilities included in the Enterprise edition. Nagios XI is available for a 30-day free trial.
Why Choose Nagios?
- Free and Open source.
- Monitors bandwidth utilization per port.
- Detects network outages and protocol failures.
- Extensible with free plug-ins
- Data log monitoring software.
Notes You Should Know Before Choosing Nagios
- The free version of Nagios comes with limited features.
- Nagios does not monitor the bandwidth issues and network availability and the network manageability is not possible.
- The interface is not simple, but confusing.
- Configuring all files might occur problems.
3. Icinga
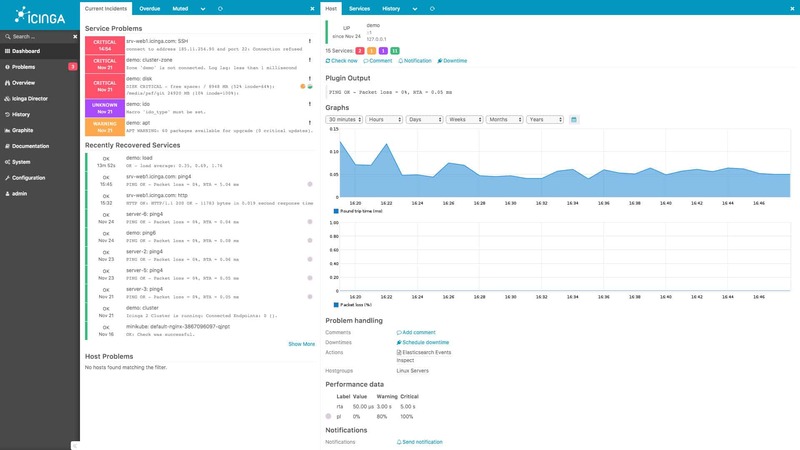
Icinga is one of the best Linux network monitoring tools that enables administrators to view the information on network connections and processes. It is an open-source network monitoring platform. Icinga collects information and assesses the effectiveness of your systems for quick troubleshooting and capacity planning that is future-proof. In terms of setup options, automation, and scale, it is unrivaled. Icinga is exceptional for its adaptability and works well in expansive and diverse situations.
To incorporate remote sites and cloud resources into the monitored system, the tool can communicate via the Internet. Transport Layer Security is used to protect all internet communications. Global firms, numerous governmental organizations, and numerous mid-sized businesses use Icinga on-premises or in the cloud across all industries.
Why Choose Icinga
- Safe and Secure.
- SNMP-based device monitoring.
- Scalability and multi-tenancy.
- Icinga includes automation and modularized integration packages.
- Comprehensive and simplified Monitoring
- Icinga comes with prebuilt alerts and reporting capabilities.
- Enterprise-Grade Support.
- High Availability.
- Support for MySQL and PostgreSQL is included.
Notes You Should Know Before Choosing Icinga
- Overwhelmed dashboard.
- Icinga does not generate PHB graphs.
- Confusing configuration.
- High learning curve; challenging for beginners.
4. Cacti
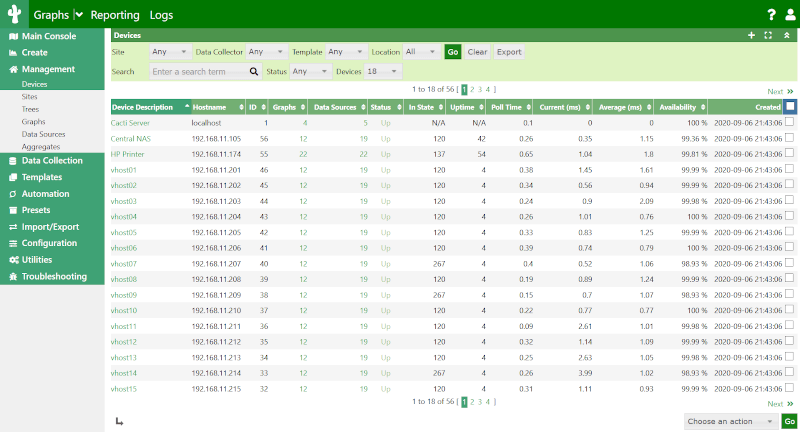
Cacti is one of the free and open-source Linux network monitoring tools that is written in PHP and come with a user-friendly interface. One of its main benefits is the thorough data collection and reporting on network bandwidth and other parameters, like user access and permissions.
Users may rapidly identify any peaks in bandwidth usage or network problems thanks to Cacti’s use of scripts to collect data and generate understandable charts and graphs. Custom graphs are created from the data, which is all saved in MySQL databases.
Cacti gives privacy settings to control who users have access to what information while allowing numerous users to monitor network devices and collect network data. Using Cacti, you will be able to detect and record traffic patterns easily.
Why Choose Cacti?
- Free and Open source.
- Comprehensive online support system.
- Cacti provides graph templating and multiple data acquisition methods.
- RRDtool based.
- Fast poller.
- Detailed graphs
Notes You Should Know Before Choosing Cacti
- Tedious configuring interface via the web interface.
- Difficult upgrading the versions if installed from the source.
- Requires a speedy Internet to install.
- Overwhelming and confusing for new users.
5. Monit
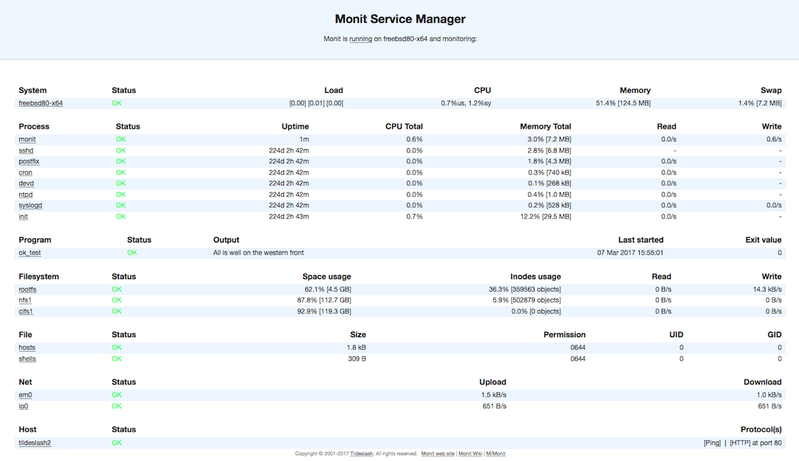
Monit is a useful tool that automatically manages server programs to increase services uptime and make sure that the file size, checksum, or permissions are always accurate as well as that they continually remain online. Additionally, Monit has a straightforward online interface that can be used to configure all the processes. With Monit, you can keep an eye on changes to sizes, checksums, timestamps, and other aspects of files, directories, and filesystems.
Using a free-format, token-oriented syntax, Monit is managed via a simple control file. You are notified of error conditions via customized alert messages when Monit logs to syslog or its log file. Monit can run several TCP/IP network and protocol checks, as well as use SSL. A browser can be used to access the Monit application, which has an HTTP(S) interface.
As one of the Linux network monitoring tools, Monit will check in on a particular process every two minutes (by default) to see how it is performing. It maintains a record of resource utilization and can act in the event of an error. Restarting processes that are utilizing excessive amounts of resources is also included in this. To manage distributed computer systems and conduct automatic maintenance, you can use Monit. Install Monit on Linux is not that complicated.
Why Choose Monit?
- Free and Open source.
- Monitors files, directories, and filesystems on localhost.
- Monitors network connections to various servers.
- Capable to test programs or scripts at certain times, like cron.
- Responsive UI.
- Monitors general system resources such as CPU usage, Memory, and System Load.
Note You Should Know Before Choosing Monit
- Monit’s UI is in PHP.
6. Netstat
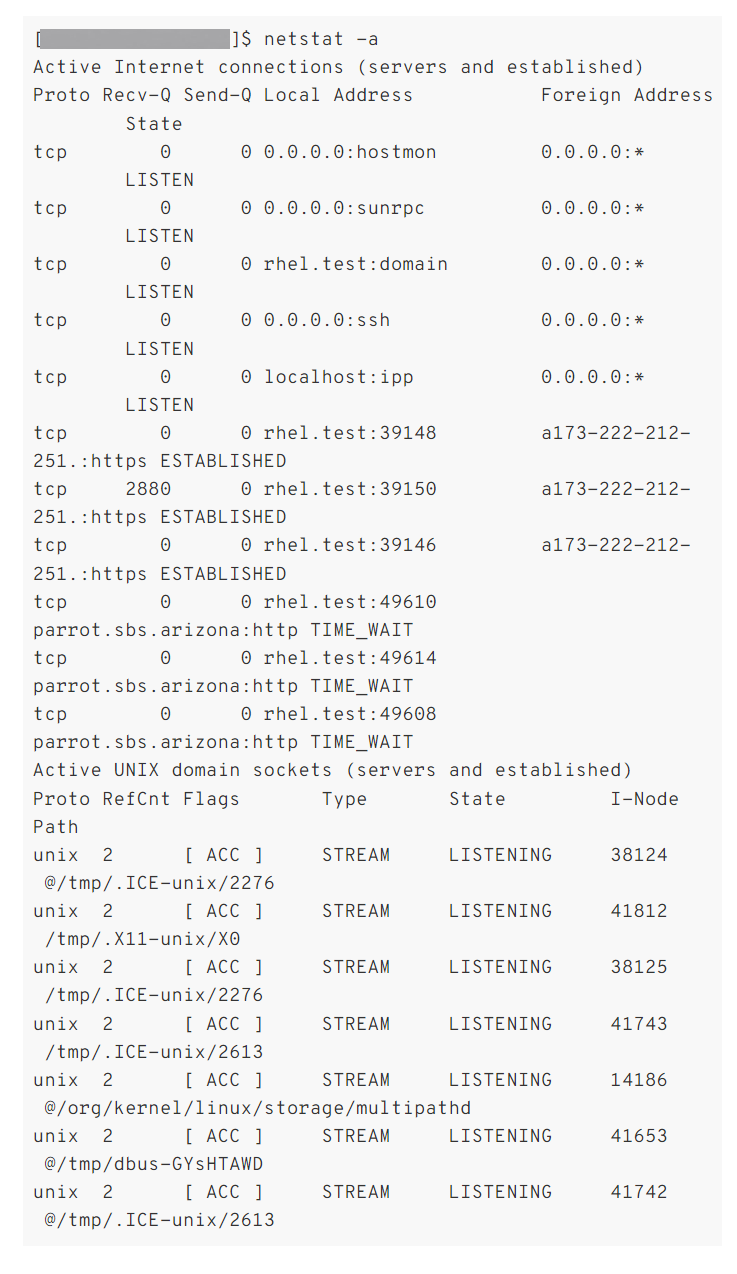
Netstat (Network Statistics) is a flexible tool for acquiring network data and can be used for configuration and troubleshooting. To determine which computers or networks a PC is connected to, netstat offers statistics about all active connections. It can also be used as a monitoring tool for network connections. A wide variety of operating systems support Netstat, a command-line application that shows the status of TCP and UDP conversations right now. When monitoring the security of a system that is being attacked or tracking down server load, connections can be extremely helpfully mapped to a particular process.
As one of the Linux network monitoring tools, it can be used to discover a wealth of data regarding the state of the connection into the device, such as which ports are open for incoming connections, which ports are actively used, the present state of existing connections, detailed protocol statistics, and many other helpful pieces of data.
To use the netstat network tool on Linux, you need to launch the Terminal. You have recently learned about the netstat command as one of the useful commands to Check Open Ports in Linux.
Why Choose Netstat
- Provides information about packets transferred and errors.
- The routing table of Netstat fives information about data packets’ journey through the network.
Note You Should Know Before Choosing Netstat
- Netstat is a command-line program and does not feature a GUI.
7. Vmstat
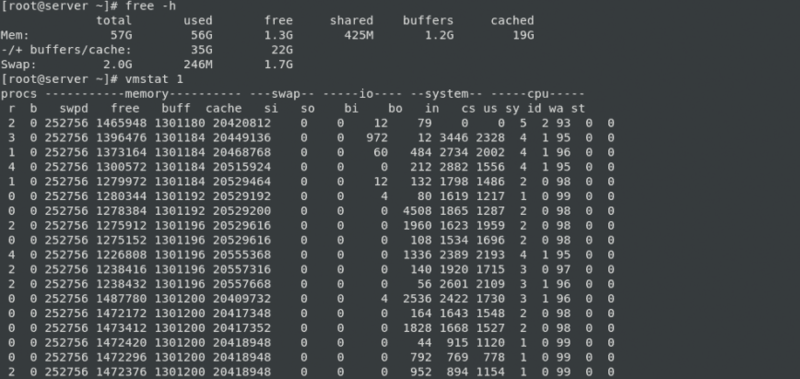
Vmstat (virtual memory statistics) is a built-in Linux system monitoring tool. To get information about kernel threads, virtual memory, disks, traps, processes, memory, paging, block IO, traps, and CPU activity you can use Vmstat as one of the Linux network monitoring tools. So, you can also balance system load activity. The memory use of a server must be monitored by Linux system administrators. Nobody desires a sluggish system. When it does, virtual memory is probably at blame, and administrators need to troubleshoot. Vmstat is crucial for virtual memory monitoring since it has a significant impact on system performance. Vmstat tracks processes, I/O, CPU, disk scheduling, and virtual memory paging in addition to this.
Vmstat can be used in shell applications as well as interactive apps. Vmstat displays system values based on the averages for each element since the server last restarted when it is run without any parameters. The results are not a snapshot of current values. The system monitoring tool sysstat, which produces CPU and device statistics and reports, includes the vmstat command. On Linux, the sysstat package is already installed.
Why Choose Vmstat
- Vmstat reports various bits of system information.
- Detects the specifics around virtual memory.
- Displays page-ins and page-outs as they happen.
- Detects shortages of physical memory to prevent affecting system performance.
8. Top
As a Linux administrator, you need to troubleshoot performance problems. To do this, you need a tool to monitor the CPU and memory usage of the considered process. In this way, you will be able to observe the changes in resource utilization throughout time.
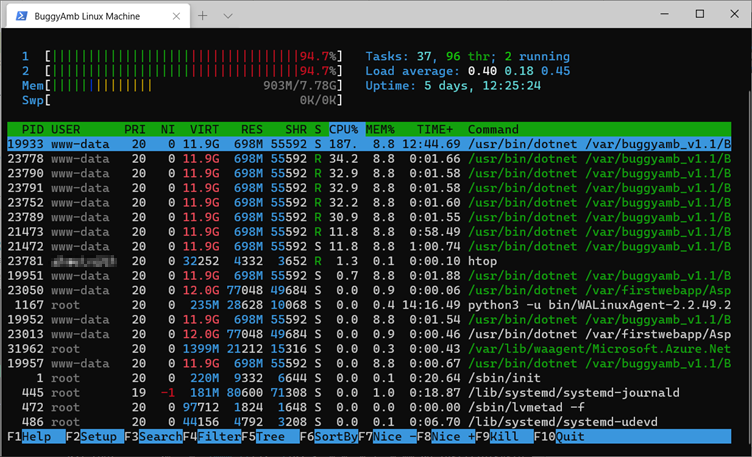
You might have heard about top command line utility or even used it before to see what process is taking the most CPU or memory. The htop tool is also one of the Linux network monitoring tools that is much easier to use for your daily tasks. Htop is a text-mode application for process viewing and real-time system monitoring. It is simple to use and shows a comprehensive list of all active processes. The htop tool is pre-installed in Ubuntu Linux. If OperaVPS is your provider, it has been installed when you buy Ubuntu VPS. Also, you can ask the support team to do this for you. If you have already purchased your server and the htop is not installed in your Linux distro, use the package manager in Linux to install it.
To view the number of individual CPU’s on your server and their resource usage broken down individually, you can use htop. After running the htop command to start this tool, a colorful output will be displayed. Htop uses color to display information about the status of the CPU, swap, and memory. The processes can also be seen using a tree view in htop.
Why Choose Htop
- Htop Troubleshot server performance issues.
- Monitor System Processes and Resource Usage.
- Shows Usage per CPU.
- Provides a meaningful text graph of your memory & swap usage.
- Easy installation on Ubuntu.
- The prettier, more colorful, and more up-to-date version of the
top. - Displays system uptime and current time.
- Process viewer and manager.
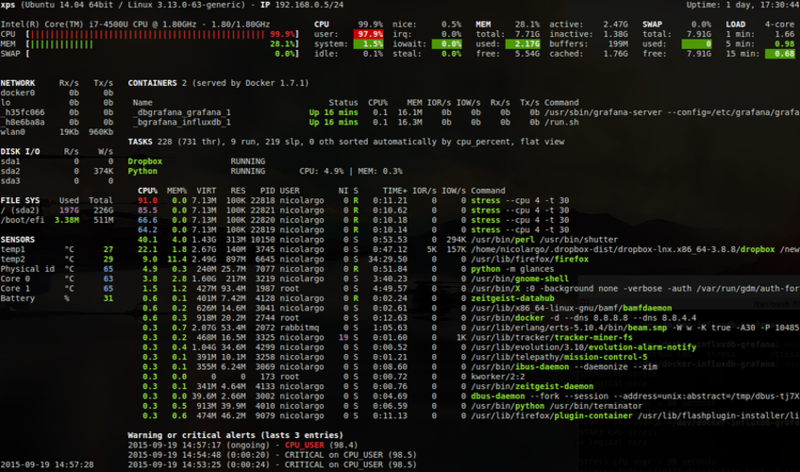
9. Glances
Glances is a cross-platform system monitoring tool written in Python. As one of the Linux network monitoring tools, Glances is known as a responsive tool. It is a monitoring tool built in that provides CPU and memory usage information and monitors filesystem I/O, network I/O. Also, the fan speed, logical volume, and hardware temperatures are monitored by the Glances monitoring tool.

Why Choose Glances
- Includes network bandwidth.
- Works in a terminal.
- Easy Installation.
- Highly customizable.
- Shows only the necessary details.
Notes You Should Know Before Choosing Glances
- Lack of color can cause confusion.
- High CPU usage.
10. Site24x7
Site 24×7 is a cloud-based network monitoring tool that offers a variety of features for many different networked devices. It uses a number of technologies, including NetFlow, sFlow, and J-Flow, to enable users to get statistics for various programs and devices. The device’s interfaces, traffic flow, and source and destination devices can all be observed using the tool. All monitored metrics have configurable threshold settings, and users can choose to receive notifications when these thresholds are exceeded.
SNMP is used by this service to keep track of network device health. The system can manage numerous sites and link them together as one WAN monitoring service because it is a cloud service and it doesn’t matter where those devices are located. Additionally, the tool can add cloud services to the network and monitor wireless networks. Using Site27x7 as one of the Linux network monitoring tools, you will be able to monitor load average, CPU, memory, disk space, network bandwidth utilization, recent events, VPNs, firewalls, printers, load balancers, switches, routers, endpoints, servers, and Linux processes.
The 30-day free trial period for NetFlow is completely functional, but the software is not free.
Why Choose Site24x7
- 100+ Plugin Extensions such as Redis, MySQL, and NGINX
- Real user monitoring.
- Reduce MTTI & MTTR.
- Websites, Network, Server, Application, and Cloud monitoring.
- SOAP Web Service Monitoring.
- SSL/TLS Certificate Monitoring.
- Server, IMAP Server, and SMTP Server Monitoring.
- DNS Server Monitoring.
Notes You Should Know Before Choosing Site24x7
- Site27x7 is Not free and is charged for by a subscription.
- Require time to learn all options and features.
Conclusion
Network Monitoring is essential for maintaining Linux server performance and ensuring uninterrupted service. By using the right monitoring tool based on your environment and needs, you can detect issues early, optimize system resources, and improve reliability.
This guide introduced the top 10 Linux network monitoring tools for 2023, outlining their strengths, ideal use cases, and considerations before use.
Evaluate your specific requirements and resources to select the best monitoring tool for your setup. If you are already using one of these tools or know another excellent Linux network monitoring tool, feel free to share your experience.
Effective network monitoring is the foundation of a robust IT infrastructure, helping prevent disruptions, reduce downtime, and maintain business continuity. Start exploring these tools today to take control of your Linux network performance.
FAQ
2. Why is network monitoring important for Linux?
It detects issues early like device failures or overloads, helping to maintain uptime, enhance security, and optimize performance.
3. Which tools are popular for Linux network monitoring?
Tools include Zabbix, Nagios, Icinga, Cacti, Monit, Netstat, and Site24x7 for monitoring servers, bandwidth, and resources.
4. How to choose the best network monitoring tool?
Consider network size, features, ease of use, and budget; open source tools suit beginners, while cloud services offer wider capabilities.
5. What metrics are monitored?
Common metrics are bandwidth, uptime, CPU and memory usage, traffic flow, latency, and error rates.
6. How do alerts work?
Alerts notify admins by email or SMS when issues arise, enabling prompt responses.
7. Can monitoring tools run automatically?
Yes, many run continuously and can auto-report or even fix issues using scripts.
8. Is network monitoring the same as bandwidth monitoring?
No, network monitoring is broader, covering device health and performance beyond just data rates.
9. Are advanced skills required?
Basic Linux and networking knowledge help, but many tools are user-friendly with good documentation.
10. Benefits of open source tools?
They are free, customizable, supported by communities, and flexible without licensing costs.